This year the theme for Maths Week Scotland is Our World so we caught up Alistair Rennie from Nature Scot to find out what mathematicians are doing to understand and protect the world around us.
Maths underpins science and allows societies to better understand and predict change, risk and ways to make the world a better place. A few simple measurements and calculations can be cleverly scaled up to understand how our coastlines have changed over the last 140 years, and how they may change under different climate scenarios over the 21st century.
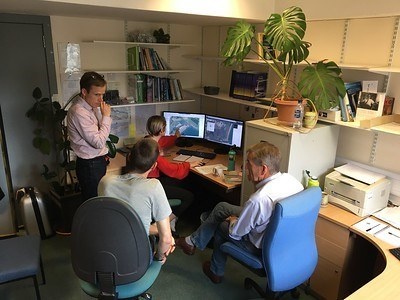
Researchers calculating coastal change
Researchers within the Department of Geographical and Earth Sciences at the University of Glasgow have measured the distances between shorelines on old and current maps. By calculating the distance between the shore lines and the time period we can establish rates of change, in meters per year.
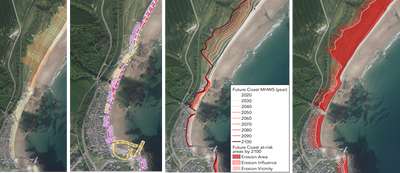
transects are laid across the shoreline (far left) to measure where old and recent maps are (centre left). These are projected forward for our climate future (centre right) to identify areas of future erosion (far right)
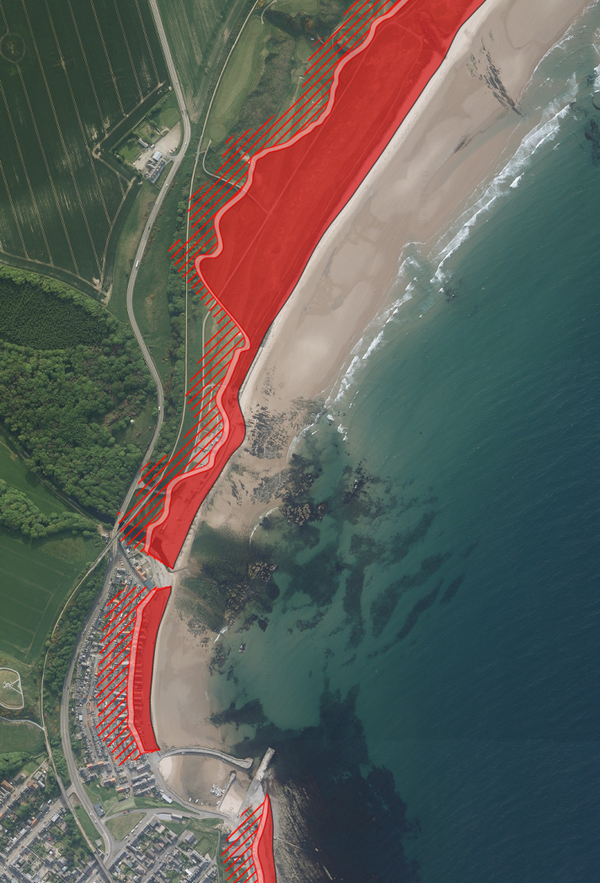
The latest research, just recently published on www.DynamicCoast.com, has also taken into consideration the amount of sea level rise which occurred during the changes to date, and used future sea level estimates to consider how erosion may increase, under low-, medium- or high-emissions scenarios, using a modified version of an equation called the Bruun Rule:
where R is the amount of future shoreline retreat, S is the amount of future sea level rise, andis the slope or steepness of the shore. The work was funded by CREW, NatureScot and the St Andrews Links Trust and the researchers have built a computer algorithm that reads in sections of shorelines across Scotland, creates perpendicular transects (from land to sea) then measures along these lines to where these intersect different dates of mapped shorelines. Bearing in mind past sea level change, the recent change is scaled into the future based on three different climate scenarios.
We then plot these future shorelines, and see what assets (roads, houses and designated sites) fall within the areas we expect to erode. This whole process makes use of algebra, geometry, topology, statistics, and more; but thankfully we have computers to run the calculations for us!
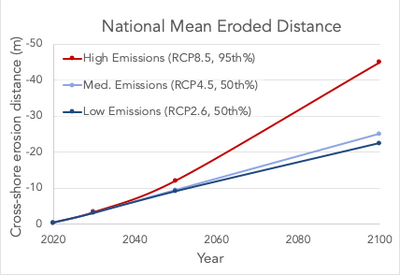
higher future sea level leads to more coastal erosion.
The final run of analysis undertook 5.5 million calculations at 10m intervals across Scotland’s coast, reflecting the High, Medium and Low Emissions Scenario on our erodible wave-dominated coasts. You can see what this means for your local beach at www.DynamicCoast.com/webmaps.
Nationally it means that under a High Emissions Scenario there are £1.2bn of roads, rail and residential property at risk, but we save £400m under a Low Emissions Scenario. So, whilst we must mitigate and adapt to climate change, and both maths and nature have their part to play!
It's Spring in Edinburgh means, which means the return of the Edinburgh Science Festival (30 March - 14 April)! This years theme is Shaping the Future, and we've browsed through the programme to pick out some of our maths highlights for you.
To mark World Meteorological Day (23 March), we are delighted to share a guest post from Professor Sylvia Knight, Head of Education at the Royal Meteorological Society, to introduce their new Climate Change Concept tool and show how teachers can use it to support maths in the curriculum.