This year the theme for Maths Week Scotland is Our World so we caught up Emma Mitchell from Nature Scot to find out what mathematicians are doing to understand and protect the world around us
Data are everywhere from Covid to Google to geese and it is messy. So how do we tidy it up? How do we make sense of that data when there is all that uncertainty? How are the models created that predict the course of the pandemic? How is Google able to target adverts? Statistics! Statistics is an area of applied maths that has been described as “the science of uncertainty”. My day-to-day work life deals with probabilities and quantifying it, but more for geese than Covid or Google.
Have you ever responded to a survey? There can be many responses and it’s the statisticians’ job to make sense of them all. It’s not just “the percentage of people said x”, it’s also considering the effect of people who didn’t answer – we need the answers to represent everyone, not just those who responded. It’s also finding the relationships in the data, such as that those who answer x to this question were more likely to answer y to that question. Notice the “more likely” in that last sentence. There’s uncertainty there and a statistician will quantify that. If the uncertainty is large, you may think nothing of that relationship, but if it’s small then there’s something to look at further. I’ve had to work with a few surveys, but mostly I work with ecological data, although the exact same principles apply. Just think of grass damage in relation to the number of geese instead.
Statistics is not just about the analysis after the data have been collected. When planning data collection, it is important that statisticians are involved from the start to make sure that the data collected will be able to answer the researchers’ questions. One of the most common questions I am asked is, “how much data do I need?” It is also important to know where to put the data collection effort to get the best out of the data once it has been collected.
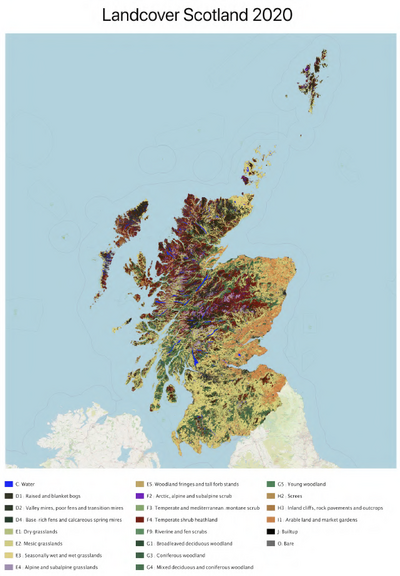
I’ve been asked this very question about validating various land cover maps over the years and I’m currently working on a habitat and land cover map created by Space Intelligence and NatureScot using satellite data and Artificial Intelligence (AI). The maps for 2019 and 2020 are at 20m resolution and involved mapping 7.9 million hectares or almost 200 million pixels and allocating each one to one of 22 different habitat classes. This map will be used to assess our natural capital which is a term for the habitats and ecosystems that provide social, environmental and economic benefits to humans – essentially the elements of the natural world that sustain humanity. To understand our natural capital and how it is changing we needed a comprehensive map that we can update at regular intervals.
Latest version of the land cover map for validation
The algorithms or AI used to classify the satellite data are given training data but they do not always get the classification right. We can assess how accurate the map is compared to the training data and it is also useful to quantify just how “right” they are compared to ground measurements or data. If the classification is correct for a reasonable percentage of the pixels, then this map is a useful one. However, if it is not correct so often it can be useful to see if there’s any sort of pattern to the “wrongness”, such as one habitat consistently being mis-classified as another. This information can help tweak the classification rules in the algorithm and create a better map.
To enable us to estimate this percentage, ecologists will visit a sample of pixels to say which broad habitat is actually there. These results will be compared to satellite imagery classifications to see which pixels visited were classified correctly and which were not and from this we can calculate the map’s correctness. But how many pixels to visit? It is not feasible to visit every pixel in Scotland. But if we were to visit too few, our estimate of how correct the map is would be very uncertain.
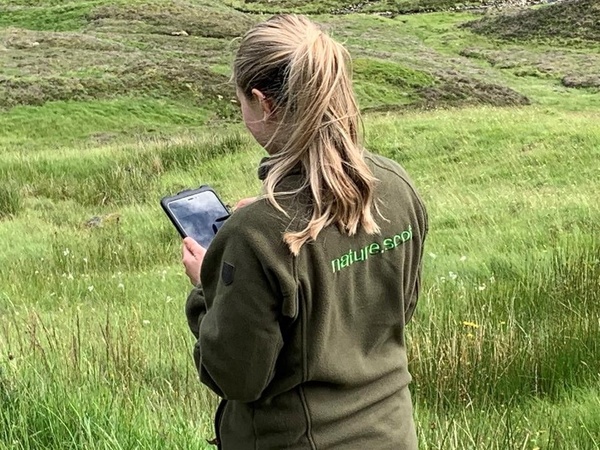
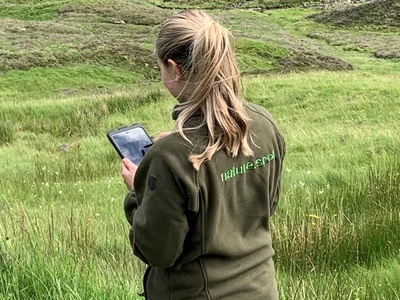
Emma Mitchell entering land validation data
Let’s say that we visited just one pixel and it classified the pixel correctly, our estimate of the map’s correctness is 100%. It is believable that if we went on to visit another two pixels that their classifications might be wrong, so now our estimate of map correctness is 33.3% - very different from the first guess. For each new piece of data we get, our estimate will change, but the more data we get, the smaller that change will be. In other words, the more data we get, the more certain we are of our estimate of the map’s correctness.
There will be a range for this estimate. If we were to survey a different set of pixels, we would end up with a different estimate. For each set of pixels, we would have a different estimate and so there is uncertainty around our estimate. However, the more pixels there are in each set, the closer those estimates will be. Luckily, using some tools in the statistician’s toolbox, we can estimate this range from the one set of pixels. It is the size of this range that is our estimate of uncertainty and it is the size of this uncertainty that the researcher is happy to accept that will drive the decision over how many pixels to visit.
Now to decide which pixels to visit. There are 22 broad habitat classes and the set of pixels to visit must represent all of them. Some of these habitat classes will be far more common than others and some will have very few pixels. We could select the pixels completely by random. This ensures that any biases that could skew our estimate in either direction are avoided. However, this is likely to end up with a set of pixels with lots of the common habitats and the rare ones may be missed entirely. An alternative is to select the pixels at random within in each habitat and we can also use accuracy figures to target our field work to habitats that we know are mapped with a lower level of accuracy. This ensures that we have data on all habitats and our effort is directed to habitats that are the most difficult to map from space.
But how many to select from each habitat? We could match the proportion of pixels in each habitat for our sample to the proportion of habitats in the map. This would ensure that the selection of pixels is a good representation of all pixels and the estimate of the map’s accuracy is a simple one. However, we would be far more certain of the correctness of the more common habitats then the rarer ones. If there is a wish to have a similar level of uncertainty for all habitats, then the number of pixels in each habitat in our sample would have to be more even. This puts more steps into estimating the map’s correctness and its uncertainty, but is still doable. For this project, these are the decisions that still need to be discussed with those managing the project.
Another consideration is the practical side of visiting the pixels. Ensuring a good spread geographically could again avoid some biases, but a far more practical approach would be to have a number of study areas and select the pixels within those. This would enable more pixels to be visited as a lot of the time spent on surveying the pixels is moving from one pixel to the next, particularly in some of Scotland’s rugged upland habitats. It also means that parts of Scotland with different habitat mixtures and different quality of satellite imagery can be targeted in this validation process. Coming up is some careful consideration with the project managers and others who have experience of this sort of project over whether this would introduce any biases and how to mitigate for those.
So far we have only discussed one visit per pixel. There is a chance that two different ecologists would classify the same pixel differently, even when following the same guidance. There is also a chance that the same ecologist would classify a pixel differently if there was some time gap between the two visits. However, it is also possible that the habitat classifications used are broad enough that this is pretty minimal. Whilst we are at the pilot stage of this project, hopefully we can get some idea on this issue.
Coming up there are some discussions with the other people involved in this project over the various options mentioned here and some decisions to be made. It’s not all spreadsheets and playing with numbers. There is also a field trip, a rare treat for this statistician!
It's Spring in Edinburgh means, which means the return of the Edinburgh Science Festival (30 March - 14 April)! This years theme is Shaping the Future, and we've browsed through the programme to pick out some of our maths highlights for you.
To mark World Meteorological Day (23 March), we are delighted to share a guest post from Professor Sylvia Knight, Head of Education at the Royal Meteorological Society, to introduce their new Climate Change Concept tool and show how teachers can use it to support maths in the curriculum.